Prometheus简介与使用
Prometheus工具简介
Prometheus 之所以流行,是因为其本身具有以下特性:- 多维度的数据模型,可以通过指标名称和键值对定义时间序列数据。
- 支持PromQL查询语言,在多维数据模型中可以灵活地查询数据。
- 不依赖分布式的存储方式,单个服务器节点可以自主抓取数据。
- 通过HTTP PULL方式收集时间序列数据。
- 通过中间网关完成时间序列推送。
- 可以通过服务或静态配置发现监控目标。
- 支持多种图形和仪表板。
Prometheus框架如图1所示。
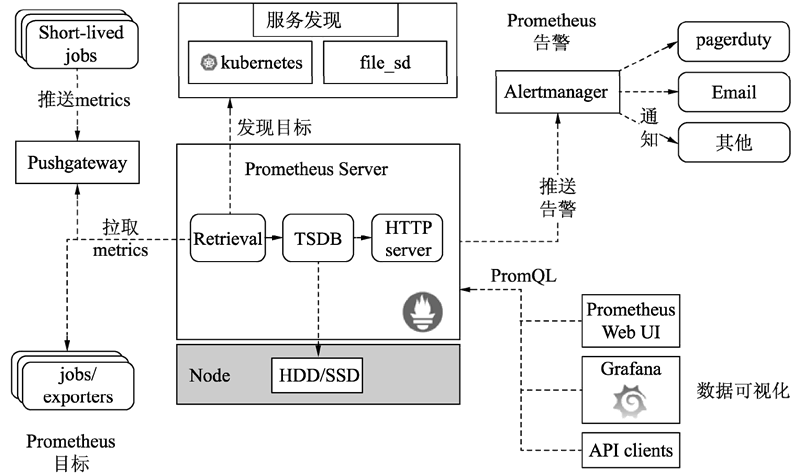
图1 Prometheus框架
Prometheus 是一个生态系统,里面包含了许多组件。其中,Prometheus Server 用于抓取数据和存储时间序列数据,Pushgateway 可以作为一个中转站运行短时间的任务,Alertmanager 可以用来处理报警,Prometheus Web UI 提供了 Web 接口,可用于简单的可视化、语句执行或者服务状态监控。
Prometheus 可以针对纯数字的时间序列数据提供多维度的收集与查询功能,并且对外依赖特别少。如果要求查询的数据完全准确的话,则不建议使用 Prometheus。
Prometheus的度量类型有以下4种:
- Counter:某个指标的累计数据。
- Gauge:某个指标的瞬时采集数据。
- Histogra:一次抓取时返回的多个数据值,包括 <basename>_bucket{le="<upper inclusive bound>"}、<basename>_sum和 <basename>_count(等价于<basename> _bucket{le="+Inf"})。
- Summary:与Histogra类似,一次抓取也可以返回多个数据,包括 <basename> {quantile="<φ>"}、<basename>_sum 和<basename>_count。
快速搭建 Prometheus
Prometheus 可以看作是一个监控平台,通过监控目标暴露出来的 HTTP 端点进行指标数据的抓取。下面讲解如何安装和配置Prometheus,以及如何通过 Prometheus 监控应用程序。(1)下载 Prometheus 包。下载地址为 https://prometheus.io/download/,选择适合自己的包即可。下载之后,将安装包解压到本地。
(2)修改配置文件。解压 Prometheus 包后,路径下有一个名为 prometheus.yml 的配置文件,内容如下:
# my global config
global:
scrape_interval: 15s # Set the scrape interval to every 15
seconds. Default is every 1 minute.
evaluation_interval: 15s # Evaluate rules every 15 seconds. The
default is every 1 minute.
# scrape_timeout is set to the global default (10s).
# Alertmanager configuration
alerting:
alertmanagers:
-static_configs:
-targets:
# -alertmanager:9093
# Load rules once and periodically evaluate them according to the global
'evaluation_interval'.
rule_files:
# -"first_rules.yml"
# -"second_rules.yml"
# A scrape configuration containing exactly one endpoint to scrape:
# Here it's Prometheus itself.
scrape_configs:
# The job name is added as a label `job=<job_name>` to any timeseries
scraped from this config.
-job_name: 'prometheus'
# metrics_path defaults to '/metrics'
# scheme defaults to 'http'.
static_configs:
-targets: ['localhost:9090']
-job_name: 'user'
static_configs:
-targets: ['localhost:8081']
# HELP go_gc_duration_seconds A summary of the pause duration of garbage
collection cycles.
# TYPE go_gc_duration_seconds summary
go_gc_duration_seconds{quantile="0"} 0
go_gc_duration_seconds{quantile="0.25"} 0
go_gc_duration_seconds{quantile="0.5"} 0
go_gc_duration_seconds{quantile="0.75"} 0.0010005
go_gc_duration_seconds{quantile="1"} 0.0089951
go_gc_duration_seconds_sum 0.0139949
go_gc_duration_seconds_count 13
# HELP go_goroutines Number of goroutines that currently exist.
# TYPE go_goroutines gauge
go_goroutines 35
# HELP go_info Information about the Go environment.
# TYPE go_info gauge
go_info{version="go1.15.6"} 1
# HELP go_memstats_alloc_bytes Number of bytes allocated and still in
use.
# TYPE go_memstats_alloc_bytes gauge
go_memstats_alloc_bytes 2.9598424e+07
# HELP go_memstats_alloc_bytes_total Total number of bytes allocated,
even if freed.
# TYPE go_memstats_alloc_bytes_total counter
go_memstats_alloc_bytes_total 8.1223112e+07
# HELP go_memstats_buck_hash_sys_bytes Number of bytes used by the
profiling bucket hash table.
# TYPE go_memstats_buck_hash_sys_bytes gauge
go_memstats_buck_hash_sys_bytes 1.470448e+06
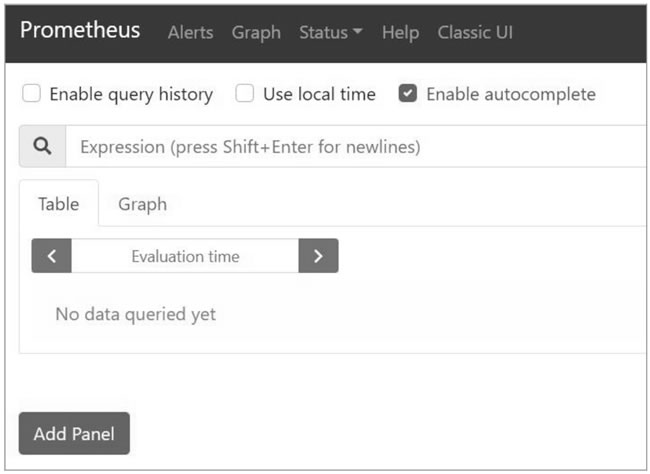
图2 Prometheus管理界面
通过执行表达式,可以查询到想要的抓取数据。如图 3 所示为与查询时间序列 http_server_requests_seconds_bucket 相关的数据。
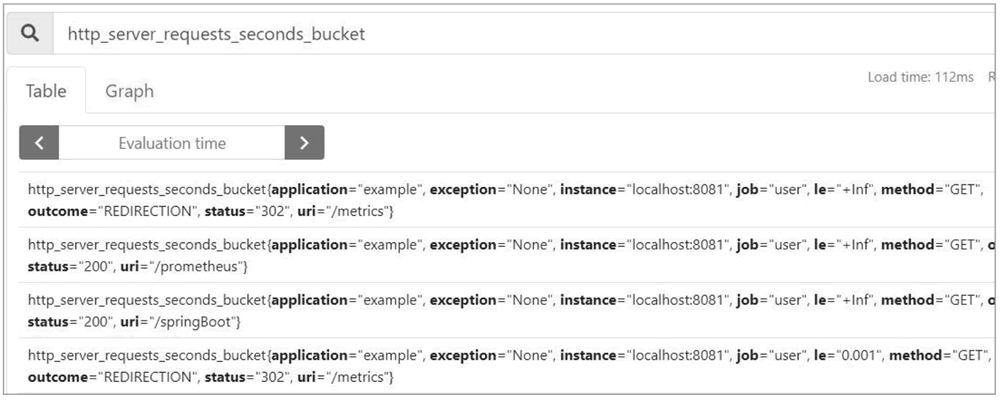
图3 Prometheus查询
可以选择以图表的方式展示查询结果,如图 4 所示。
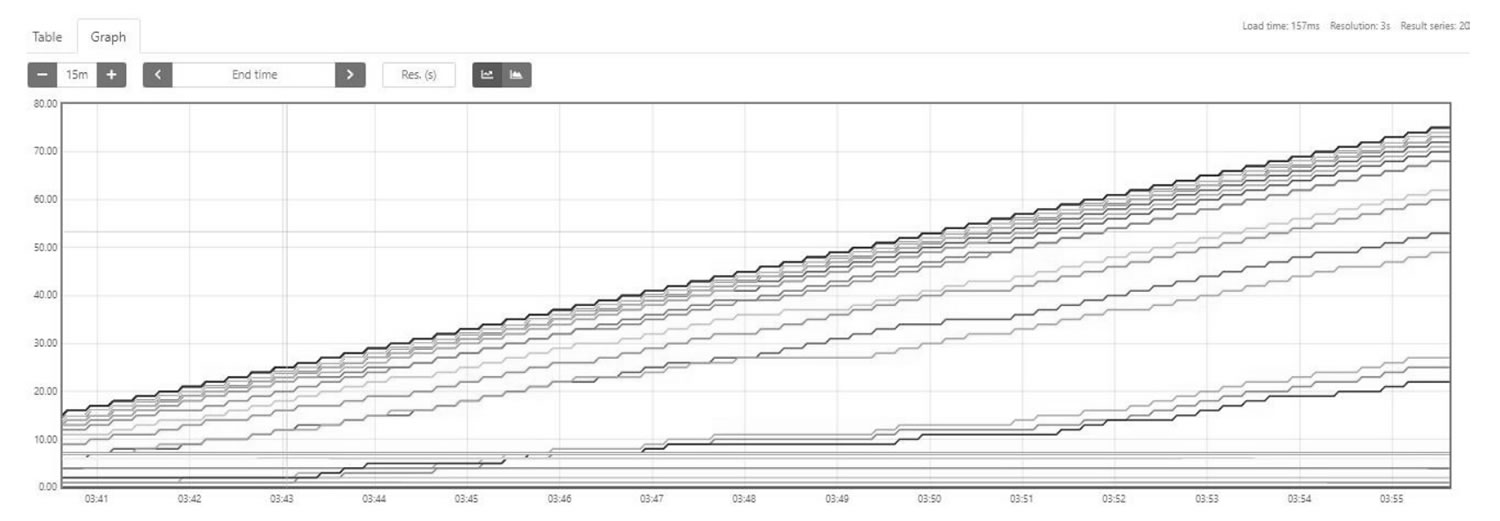
图4 Prometheus指标统计
Prometheus 存储的数据是以时间序列的方式展示的,通常定义 metrics 时会包括一个名称和多个键值对的标签,通用示例如下:
<metric name>{<label name>=<label value>, ...}
例如,如果一个 metrics 名为 api_http_requests_total,标签键值对是 method="POST" 和 handler="/messages",则一个时间序列如下:api_http_requests_total{method="POST", handler="/messages"}
更多的查询例子,可以参考 Prometheus 官方文档。