Matplotlib pie:饼状图
饼图主要用来展示整体和部分之间的关系。在 Matplotlib 库中主要使用pie方法来绘制饼图。

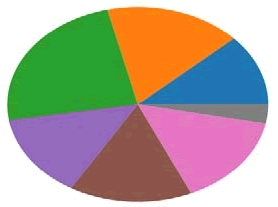
图1:饼状图
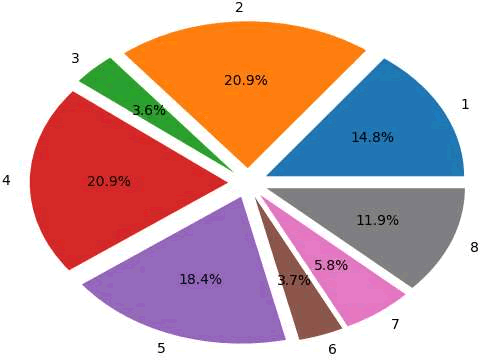
我们还可以通过传入参数 explode 设置中心偏离,参数 labels 设置饼图的标签,autopct 设置百分比显示。示例代码如下。

图2:变更样式后的饼状图
In [1]: import numpy as np
   ...: from matplotlib import pyplot as plt
In [2]: y = np.random.normal(2,1.0,8)
In [3]: plt.pie(y)
Out[3]:
([<matplotlib.patches.Wedge at 0x8f3f2b0>,
  <matplotlib.patches.Wedge at 0x8f3f780>,
  <matplotlib.patches.Wedge at 0x8f3fc50>,
  <matplotlib.patches.Wedge at 0x8f4f198>,
  <matplotlib.patches.Wedge at 0x8f4f6d8>,
  <matplotlib.patches.Wedge at 0x8f4fc18>,
  <matplotlib.patches.Wedge at 0x8f5a198>,
  <matplotlib.patches.Wedge at 0x8f5a6d8>],
......
结果如图 1 所示。

图1:饼状图
我们还可以通过传入参数 explode 设置中心偏离,参数 labels 设置饼图的标签,autopct 设置百分比显示。示例代码如下。
In [1]: import numpy as np
   ...: from matplotlib import pyplot as plt
In [2]: y = np.random.normal(2,1.0,8)
In [3]: labels=range(1,9)  # 设置标签
   ...: explode = [0.1]*8  # 设置偏离
In [4]: plt.pie(y,explode=explode,autopct='%1.1f%%',labels=labels)
Out[4]:
([<matplotlib.patches.Wedge at 0x8f01400>,
  <matplotlib.patches.Wedge at 0x8f01b70>,
  <matplotlib.patches.Wedge at 0x8f0a320>,
  <matplotlib.patches.Wedge at 0x8f0ab00>,
  <matplotlib.patches.Wedge at 0x8f19320>,
  <matplotlib.patches.Wedge at 0x8f19b00>,
  <matplotlib.patches.Wedge at 0x8f23320>,
  <matplotlib.patches.Wedge at 0x8f23b00>],
结果如图 2 所示。

图2:变更样式后的饼状图
